Data Visualization and Reports
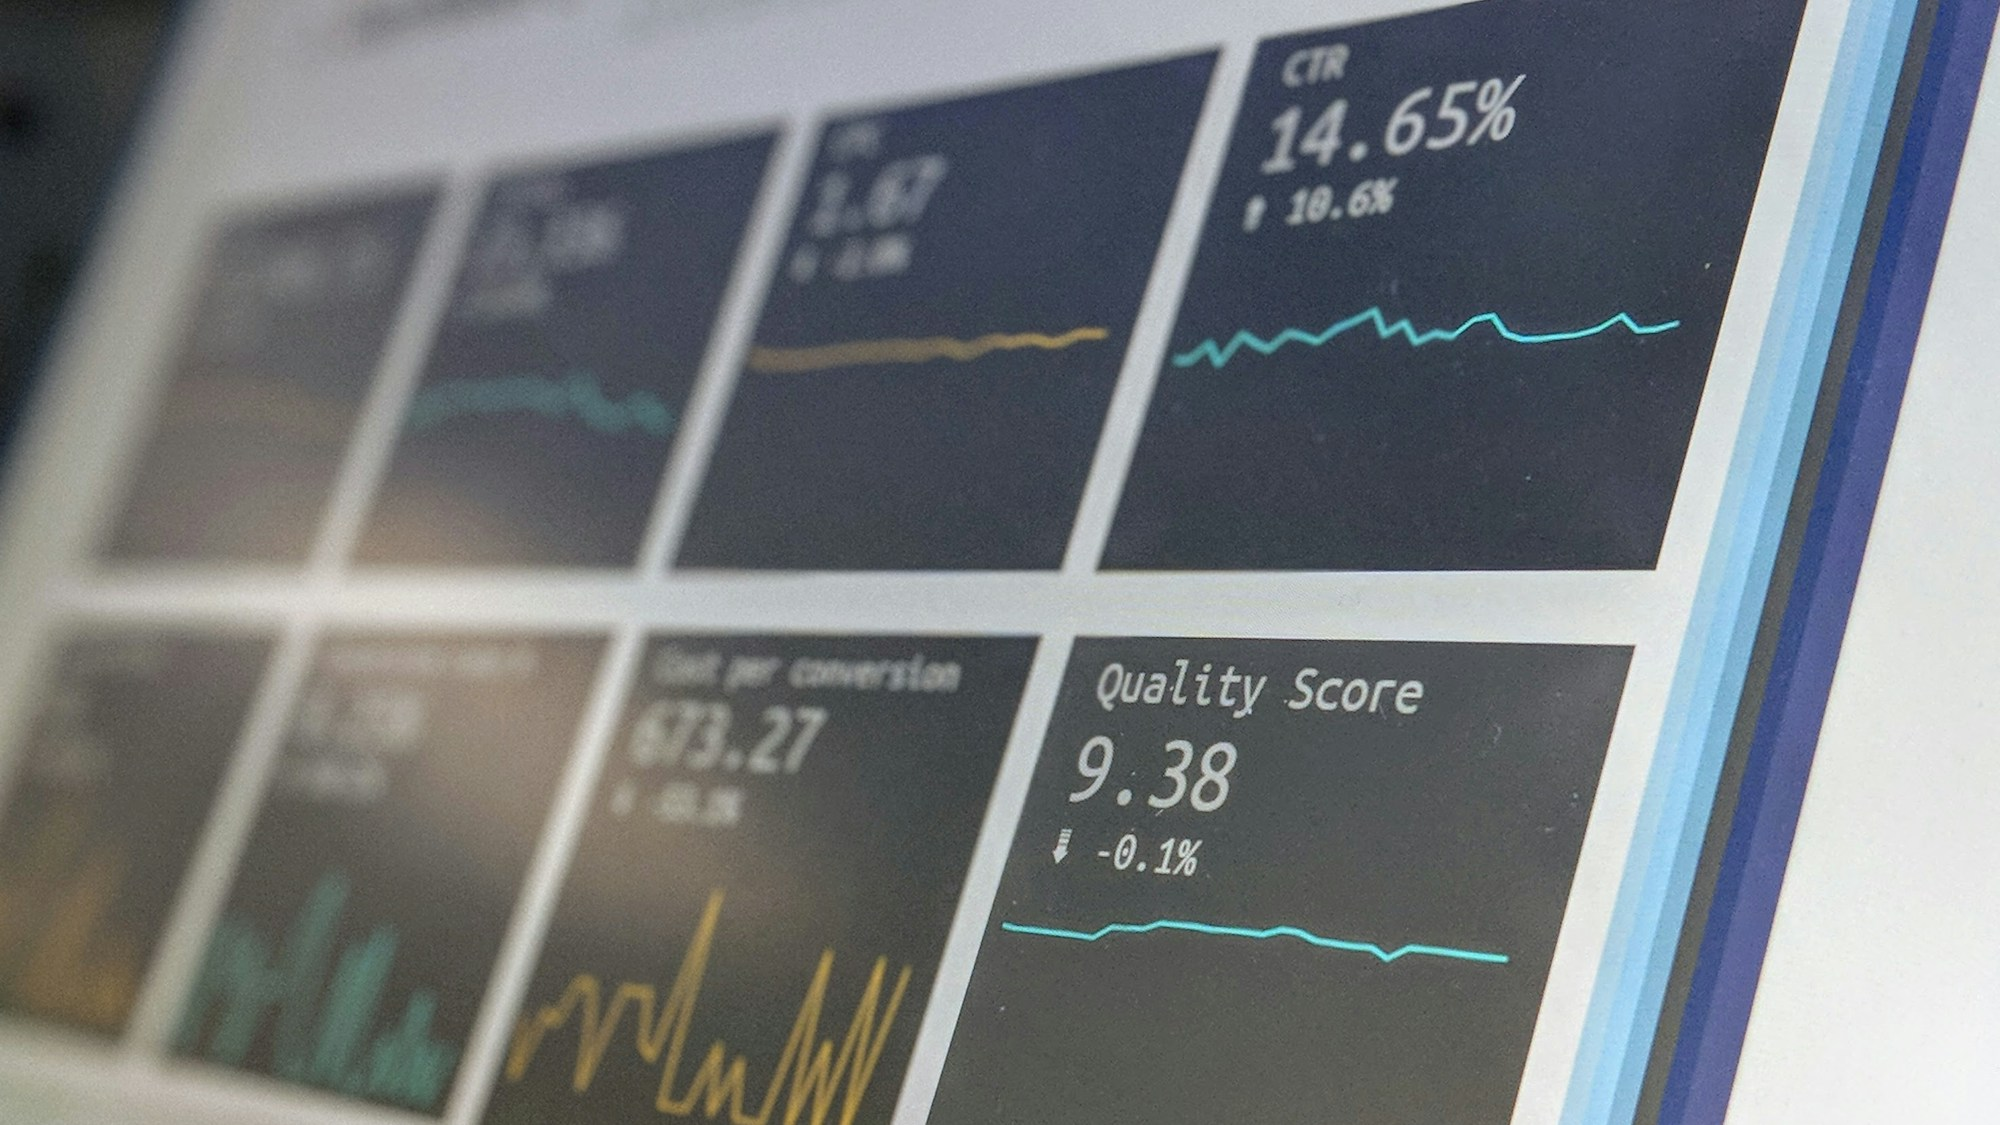
We strongly believe that data has the power to tell compelling stories. Leveraging advanced visualization tools and techniques, we transform complex datasets into intuitive and visually appealing dashboards and reports.
Our team crafts interactive visualizations that empower stakeholders at all levels of your organization to comprehend and interpret data effectively. These meaningful visual representations facilitate data-driven decision-making and facilitate impactful communication.
We help you make empowered decisions.

HOW WE DO IT?
By transforming complex data into digestible visuals, data visualization and reports. From intricate charts to dynamic dashboards, these graphical representations help elucidate trends and patterns, rendering data accessible and intuitive.
This is how we empower organizations to make informed decisions, optimize operations, and achieve their strategic goals.


